Analysis Traceability
HyperX ensures data visibility in every step of design. Plot and query data at any time directly on the model or with watch window data tables.
Capability Pages

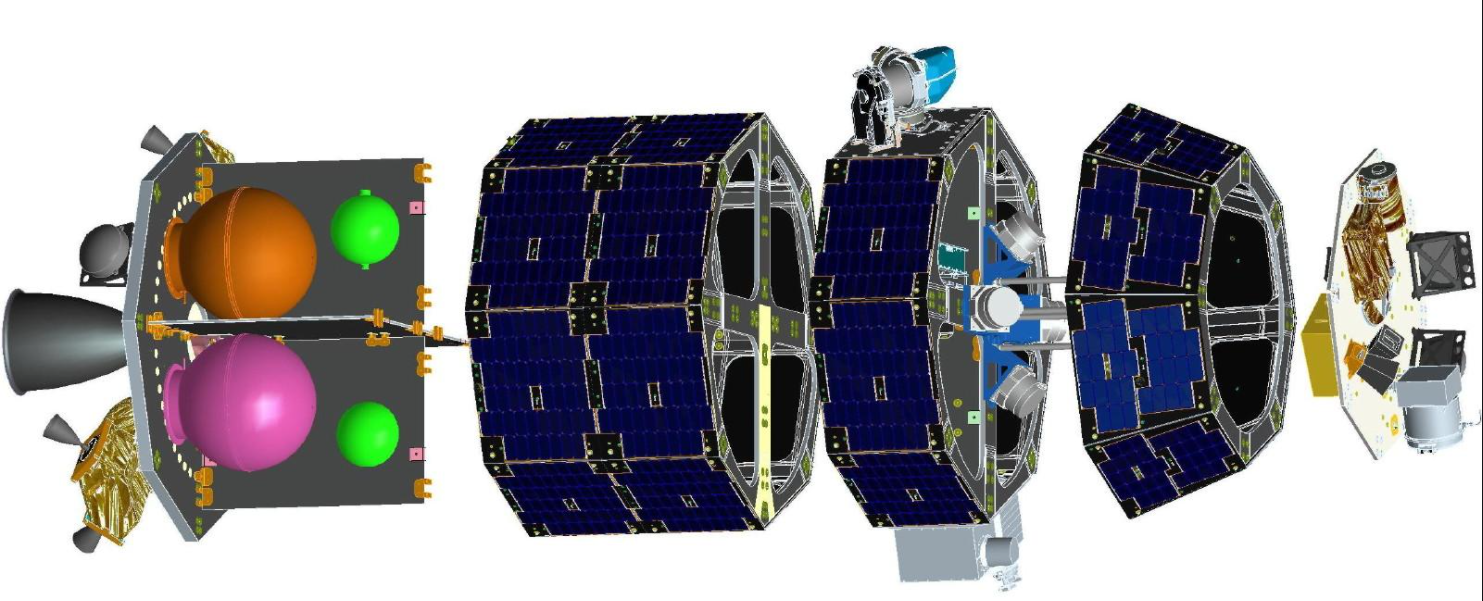
“HyperSizer performs extensive trade-off studies, determines suitable materials, and calculates safety margins at all design stages from preliminary layout to flight certification.”
“In all, the software calculated 1 billion structural margins and organized the data into detailed illustrations of critical loads and failure modes.”
“About 1 billion safety margins were calculated during HyperSizer’s stress analysis of the NASA Ames Lunar Atmosphere Dust and Environment Explorer (LADEE) space primary structure.”
See Relevant News Article: Machine Design – Software Lets Spacecraft Carry Heavier Loads
Plot all relevant input and computed data directly on the model for enhanced understanding of all sizing and analysis results occurring throughout the analysis.
The legend is the foremost data visualization tool in HyperX. Use it to see hundreds of different HyperX specific data types on the FEM.
Computed Outputs
Use the ‘Analysis Results’ menus to plot important results such as:
- Critical margin of safety per zone
- Controlling load case per zone
- Controlling failure criteria per zone
- zone unit weight
Intermediate data values from margin calculations can also be plotted – allowing the user to understand what caused a specific margin value.
Directly plot all sizing results per zone – visualize dimensions (thickness, ply count, panel height, etc.), selected laminates, materials, and fastener types.
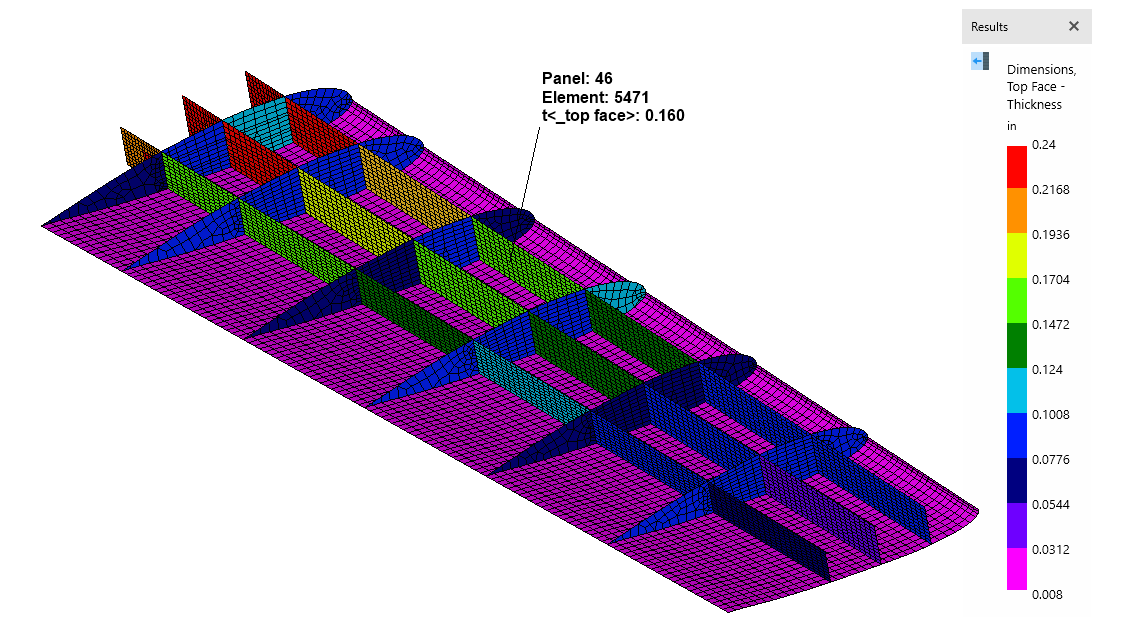

Example legend plot showing the resulting thickness per panel.
The legend is also a convenient tool for creating plots and screenshots. Each plot can be customized by selecting minimum and maximum values and corresponding color bin scales. You can also use the data probe to call-out and label particular values of interest.
Data Inputs
Understand exactly what analysis and sizing inputs have been applied by plotting FEA results, panel buckling spans and curvatures, and stiffness term constraints. Also, cross-check the inputs that have been applied to the model to define the design space, loads processing technique, and analysis criteria, respectively.
Tabulate data for a selection of zones. Use this real time, interactive data to trace through analysis calculations and supplement reports.
The Watch Window shows a tabular snapshot of data for selected zones. Any input, analysis result, and sizing result can be shown here. This live data table dynamically updates according to data and zone selection – thus providing additional control over analysis traceability.
The image below shows a plot of the minimum margin of safety per zone of a wing skin. The Watch Window is a data table containing the margin values and sizing results in-line.
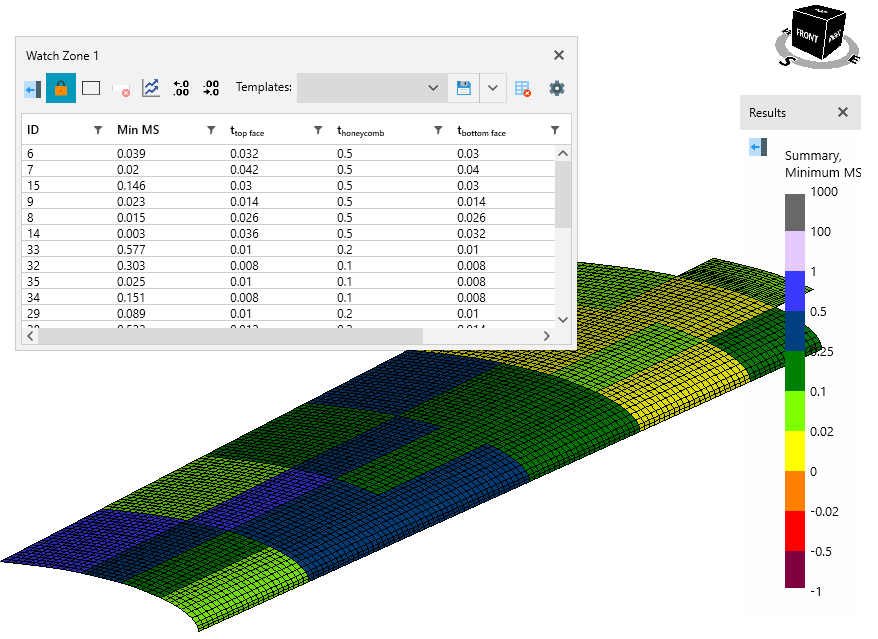

Take this idea a step further by ‘locking’ the data in this window, tweaking inputs, and re-running. Directly compare your new results to those still maintained in the Watch Window.
All data in this window can be copied and pasted directly to Excel spreadsheet for additional post processing and reporting.
The Analysis Watch Window automatically lists every single margin of safety for the zones selected.
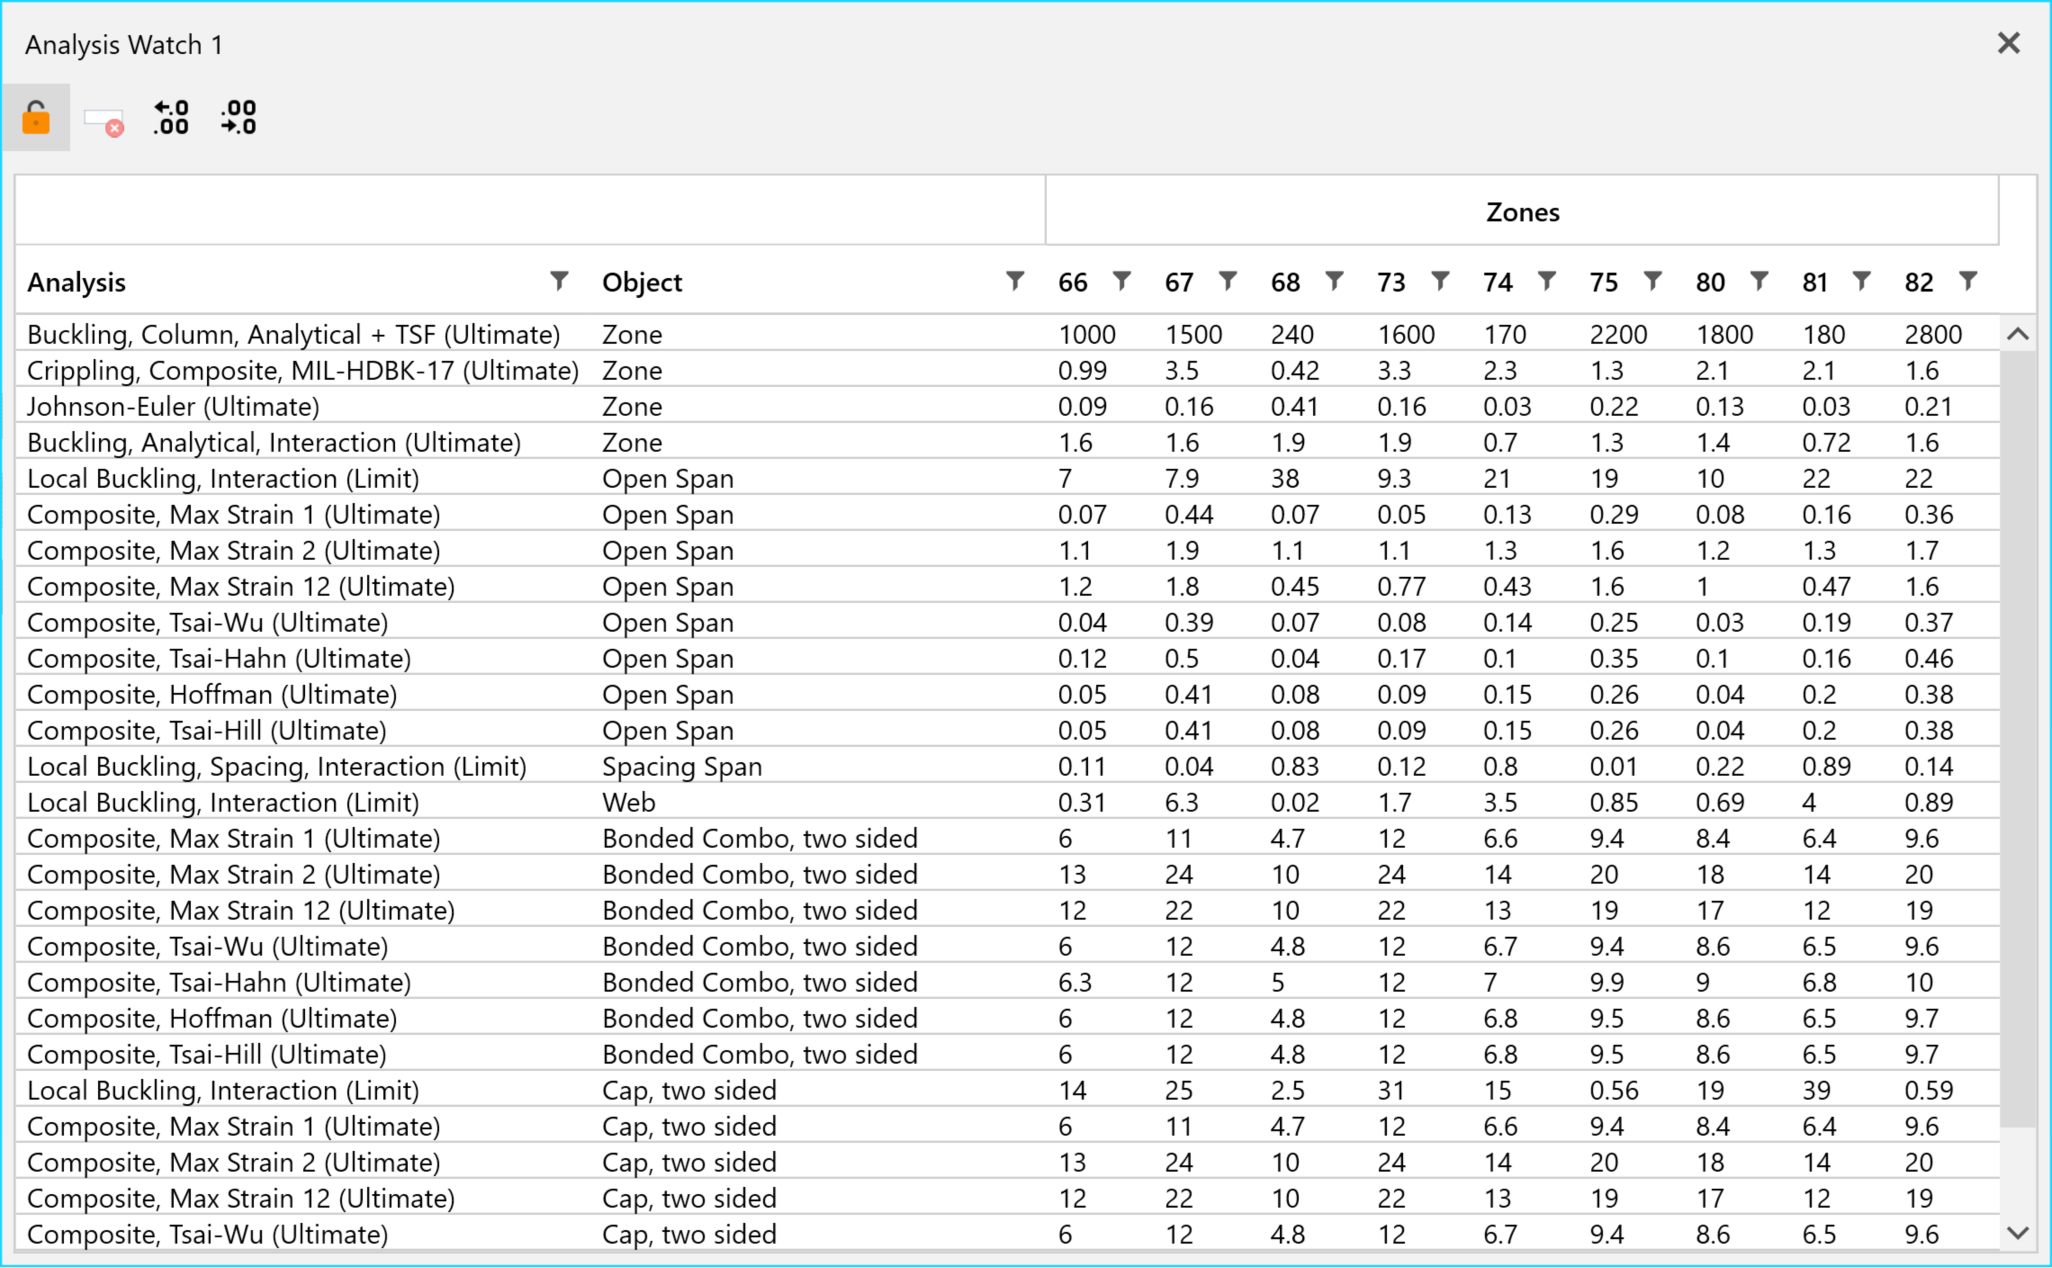

Example Analysis Watch Window populated for a selection of composite stiffened panels.
An example analysis watch window for a group of composite stiffened panels is shown above. Each row represents an active analysis criterion, each column represents a zone, and each data value is the corresponding margin. Notice that each zone is further broken up by object (i.e. span, web, cap, etc.) to add another level of detail for interrogation and understanding. In summary:
- The analysis watch window is interactive with the model in the viewport
- Can filter and sort columns
- Can copy out for reports
- Analysis details and methods documentation available via right-click
Contact Us
This site is protected by reCAPTCHA and the Google Privacy Policy and Terms of Service apply.
