Streamline Workflows
Reduced process cycle time is assured with digital engineering – automation of processes, the connectivity of data as threaded through HyperX stress framework to the customer’s analysis plugins.


Capability Pages
Introduction
See Relevant News Article: NASA Advanced Composites Consortium in the News
NASA Advanced Composites Consortium
Boeing, Spirit AeroSystems, United Technologies, Northrop Grumman, Aurora, GE Aviation, Lockheed Martin, NASA, FAA, and our company Collier Aerospace (previously Collier Research).
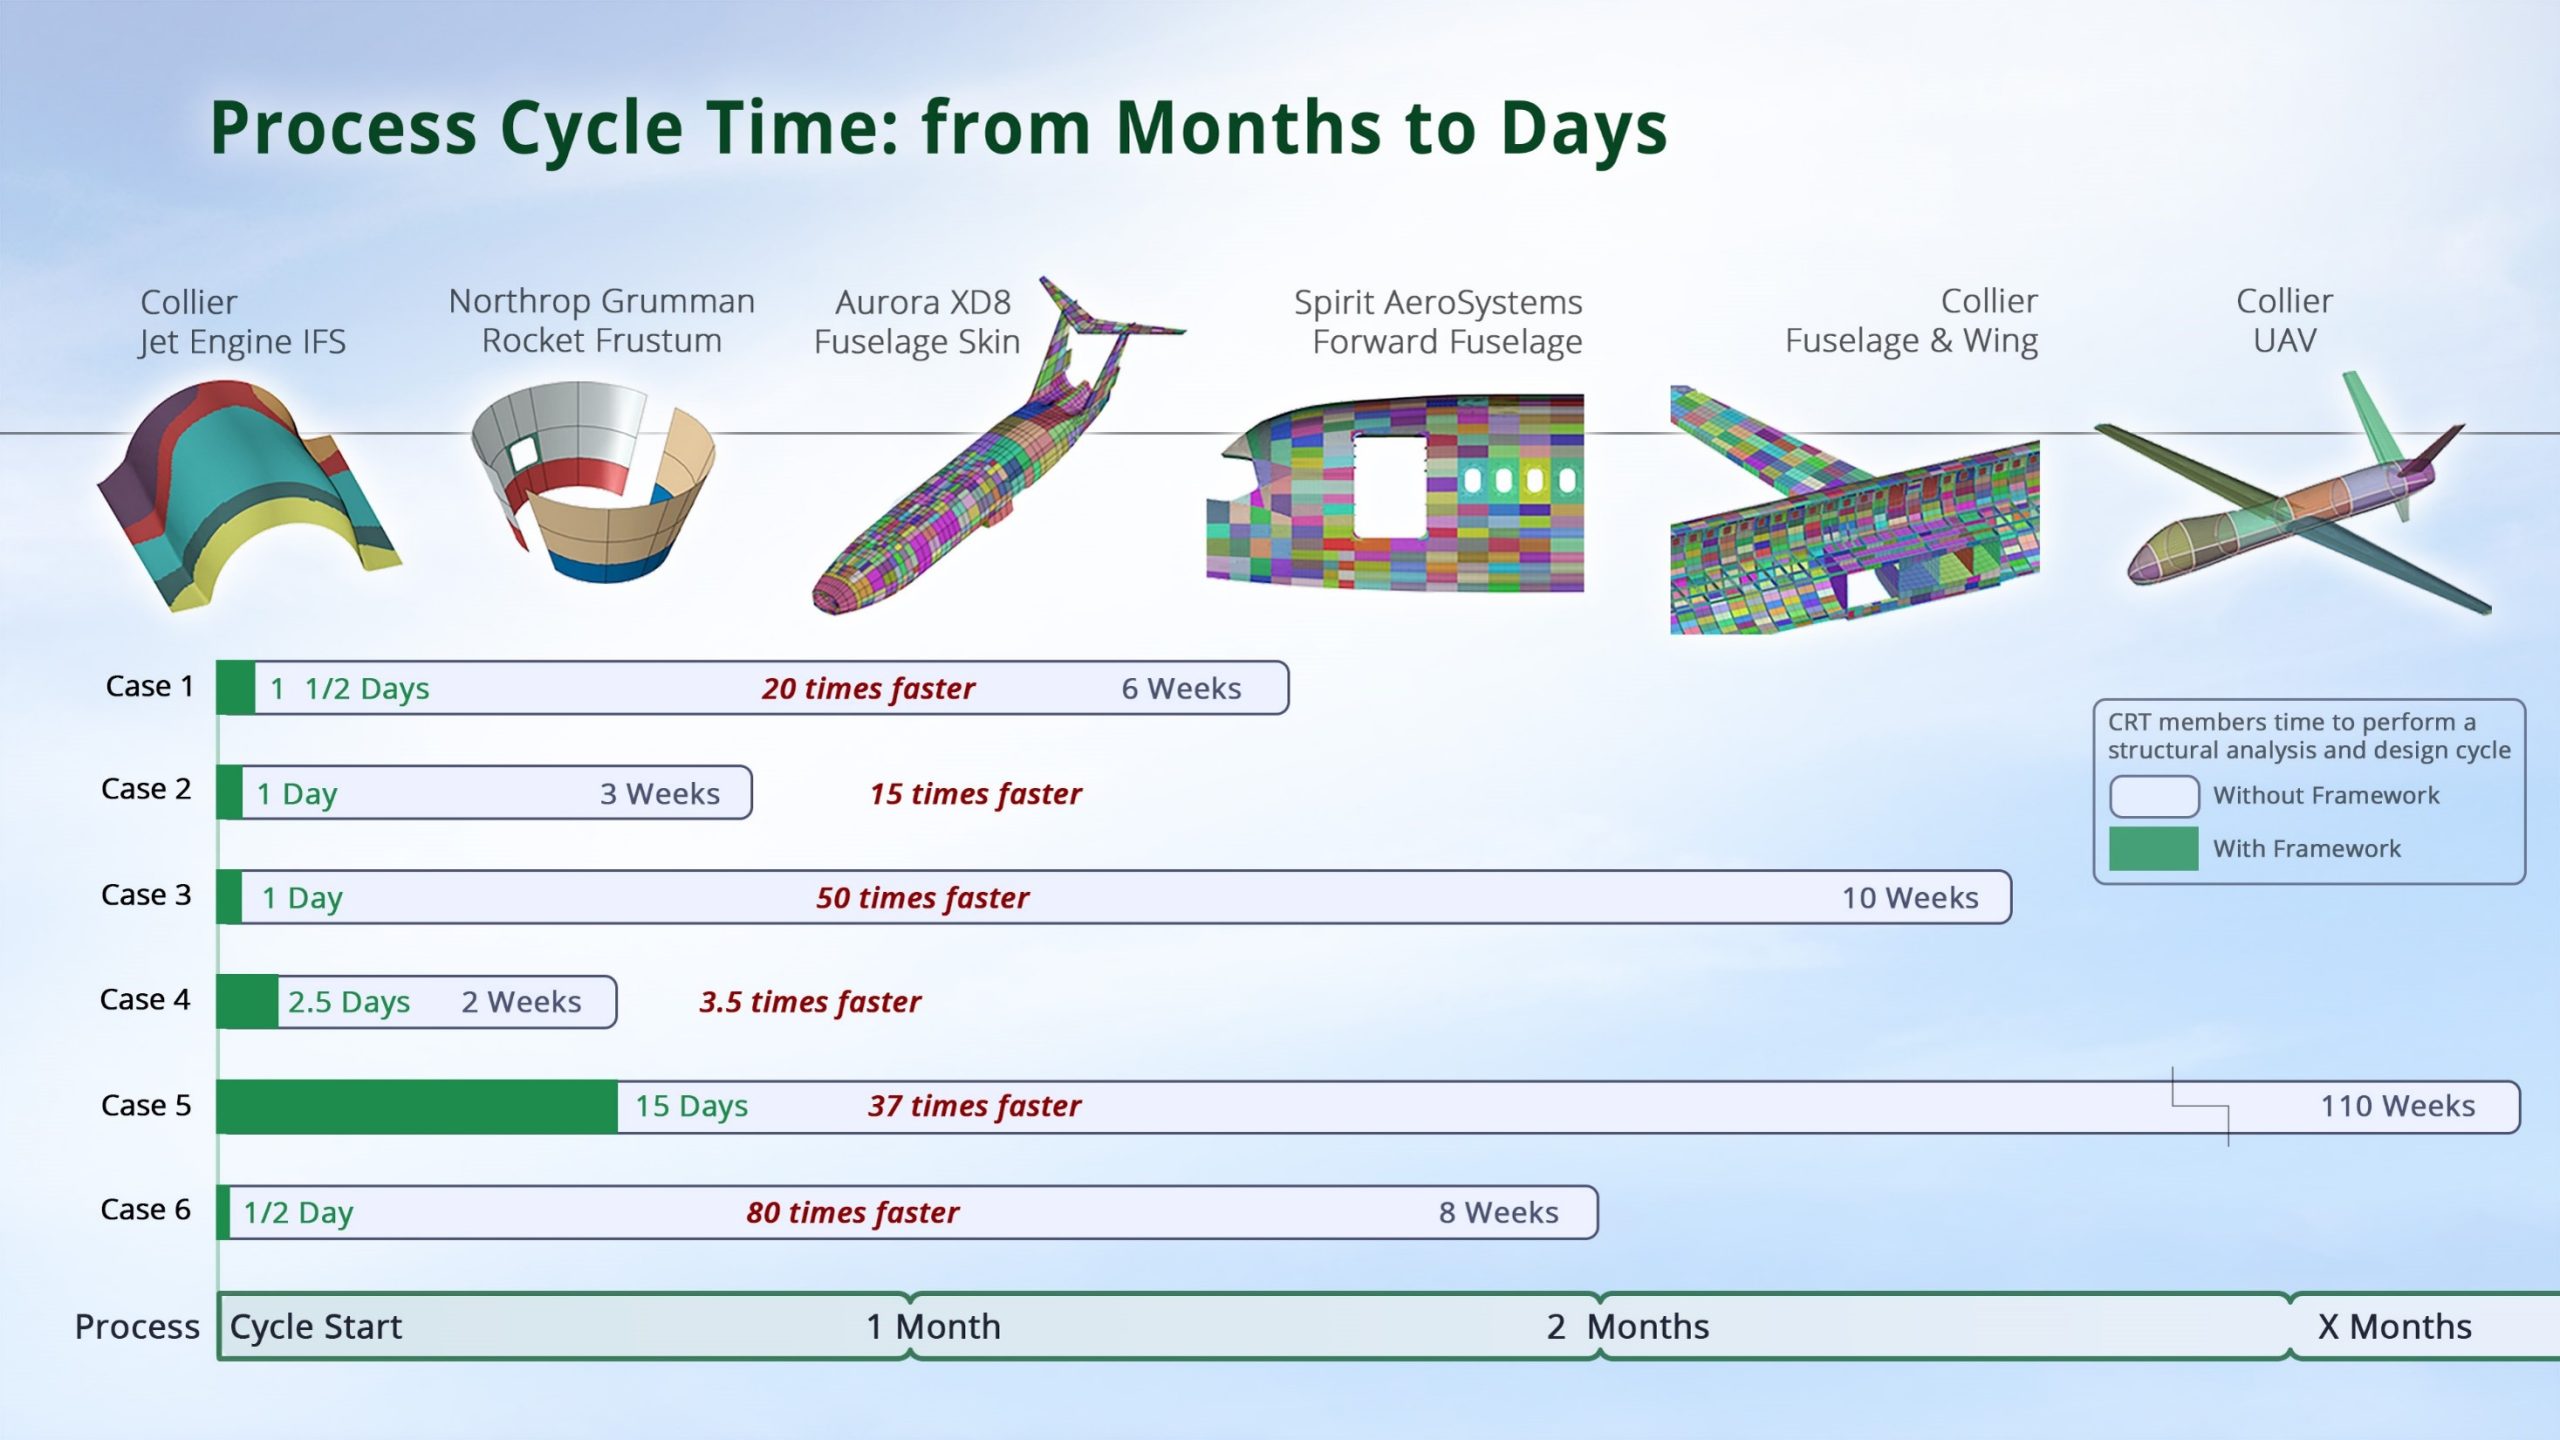
Collier Aerospace was lead of the Rapid Tools Cooperative Research Team and lead of the Design for Manufacturing Cooperative Research Team of the NASA Advanced Composites Project (ACP). Four aerospace tools were implemented in the HyperX (previously HyperSizer) stress framework and then evaluated in terms of reduced process cycle time.

NASA Advanced Composites Consortium. Reference AIAA technical paper
AIAA SciTech 2020 Unified Analysis Tools PDF Download
The four tools (two bay crack large notched damage, impact and compression after impact strength (CAI), stiffened panel postbuckling, and bonded joints) were plugged into the HyperX stress framework and used on the structures illustrated in the above figure. Time savings reported were based on consortium participation and oversight.
Rapid structural analysis tools have become an important part of the design cycle for aerospace companies in recent decades. When these tools were first developed, there was little consideration for shared software infrastructure. This made design and analysis cumbersome for several reasons: incompatible output data and reporting formats, detailed hand edited tedious input files, as well as results with limited transparency.
Workflow Automation
HyperX is a framework for industry-accepted FEA, CAD, CAM, and company developed software, automating data exchanges without loss of information or extra engineering effort.
HyperX provides an automated software framework for executing rapid tools to analyze and size, quantify margins of safety for thousands of load cases, and generate reports in support of FAA certification. It can be deployed from the beginning to the end of the design process using analytical methods for design sizing, analysis, and certification reports. Our HyperFEA® tool automatically iterates in a continuous loop with FEA solvers, searching for lightweight structurally sound options.
Doing all of this seamlessly and without disrupting your company’s existing engineering processes will help you achieve the best design results possible in a shortened schedule.
Using HyperX during early design, engineering teams can explore a wide-open conceptual space and perform trade studies involving thousands of alternatives. This enables the calculation of robust design options with minimal weights, an approach that leads to the greatest overall weight savings and to multiple alternatives for considerations such as manufacturability, rate, and cost.
The software determines optimum cross-sectional dimensions of stiffened composite panels representing any panel shape/size. While executing composite analysis it defines laminate area zones, fiber orientation, layup stacks, ply sequencing and interleaving, and helps to minimize ply drops/adds – all of which improve manufacturability.
During this process of going from initial sizing optimization to final detail analysis, the software provides additional rapid workflows. All material, laminate, and part sizing data can be automatically transferred intact to the FEM for continued refinement and iteration.
As the design progresses, cross-sectional dimensions and laminate specifications are finalized, and margins of safety calculated, with failure analyses stress reports automatically generated by the software for all parts required for flight certification.
Model Centric User Interface
Interact directly with the model and HyperX entities at all times. The user has multiple ways to manage visibility, selection, organization, and assignment.
- Interactive and responsive user experience
- Model-centric interaction with data – set up inputs, size/analyze, and review results in context
- Data visualization and traceability through all workflows
- High-performance graphics can handle large models with millions of elements
- High performance database can handle terabytes of data
- Drag-and-drop Interaction between tree and viewport
FEM Viewer
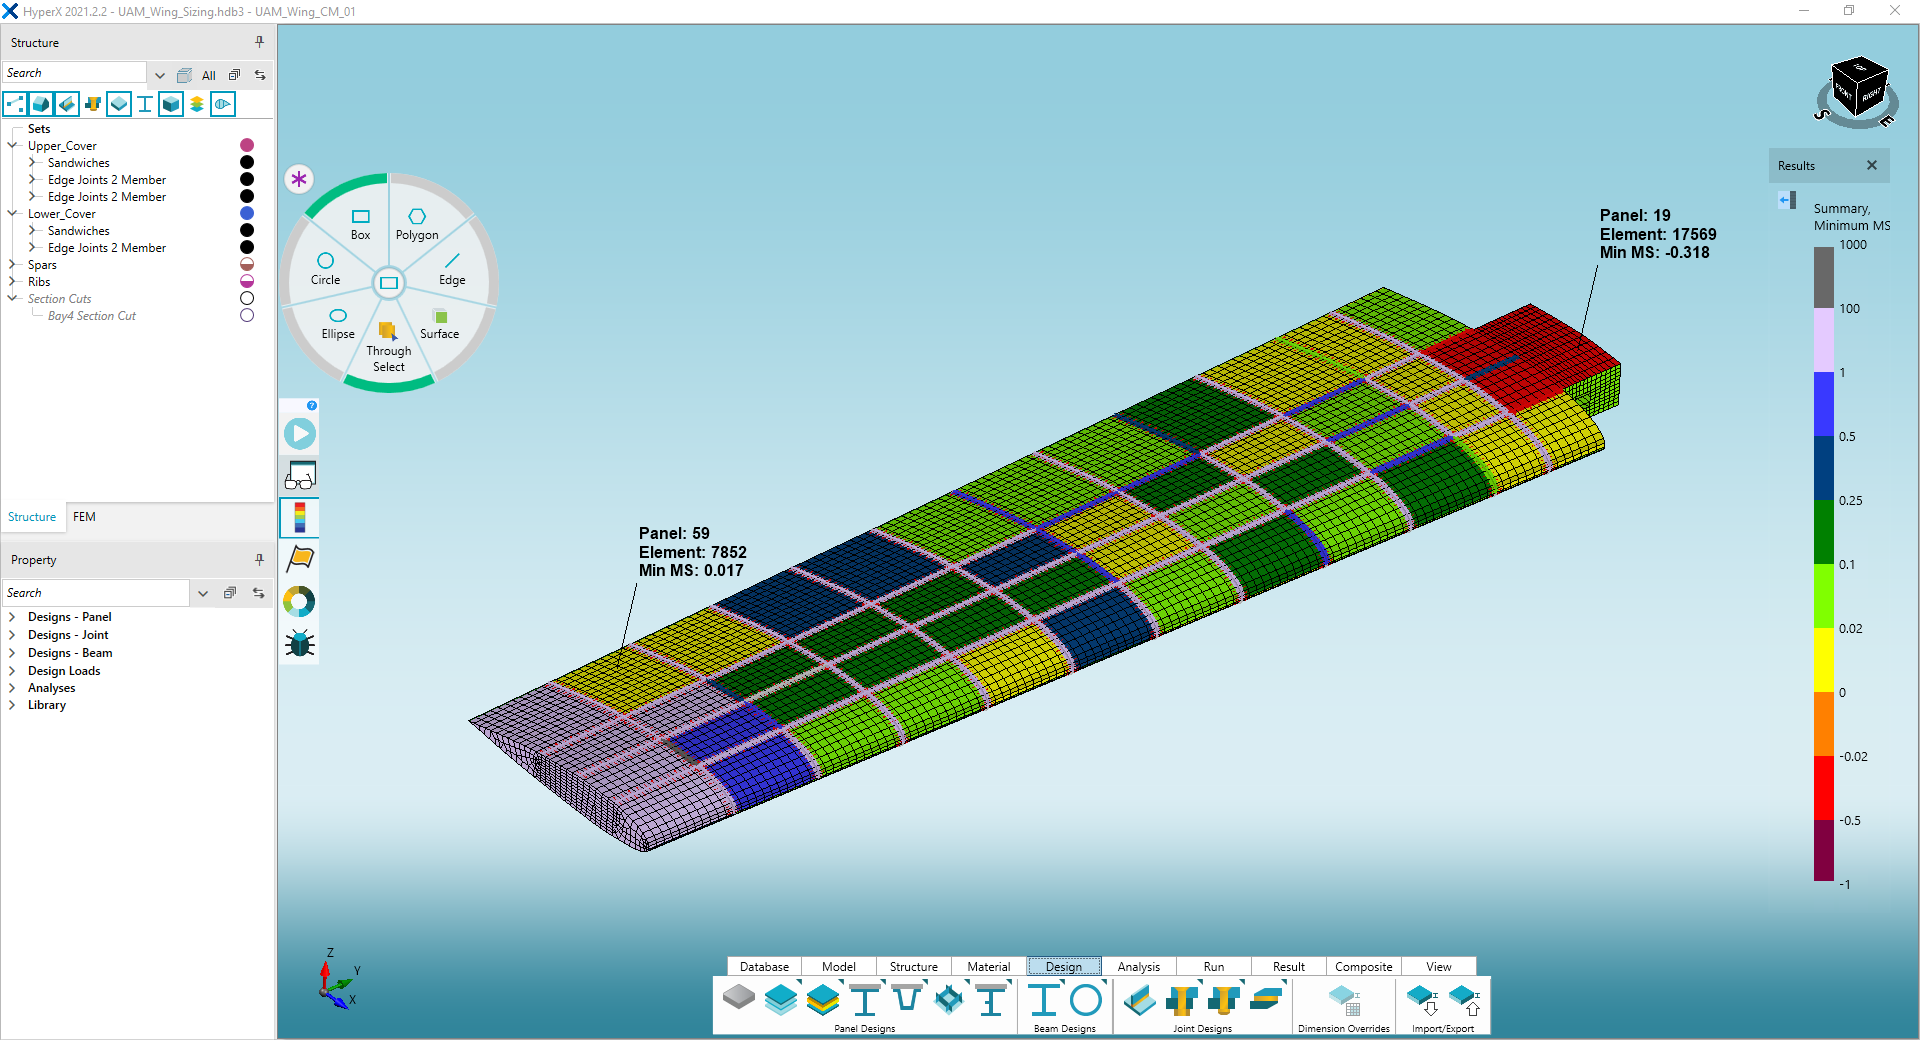

Different panel concepts evaluated for wing skin.
- Selection wheels allow you to easily interact with the elements and zones of the FEM or CAD data
- Legend and watch windows display HyperX data on the FEM
- Quick access Ribbon is placed at the bottom for less mouse movement
- Context sensitive right click menus further reduce mouse movement
To learn about the interface, we encourage you to watch the essential video “User Interface”
Trees
Interact directly with the model and HyperX entities using the four trees for FEM, CAD, Structures, and Properties that are in sync with the viewport at all times.
Once analysis and sizing are executed, the weights and critical margins of safety, per structural zone are displayed in the tree. The summation of weights is rolled up to the parent tree node Set, and then rolled up again to the project node.
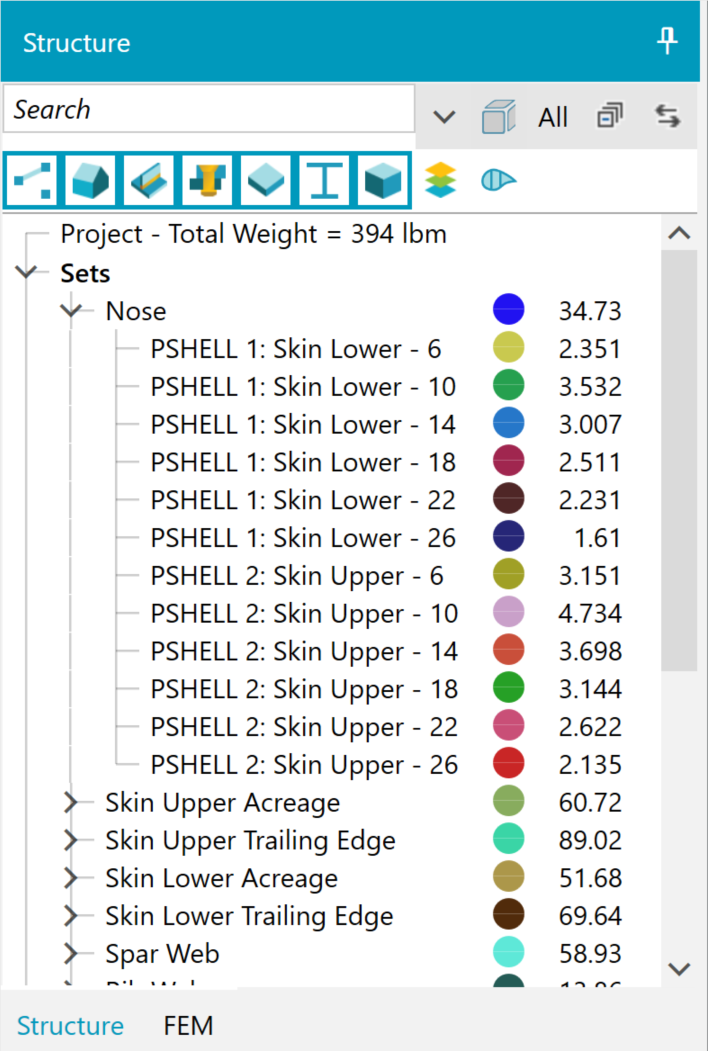

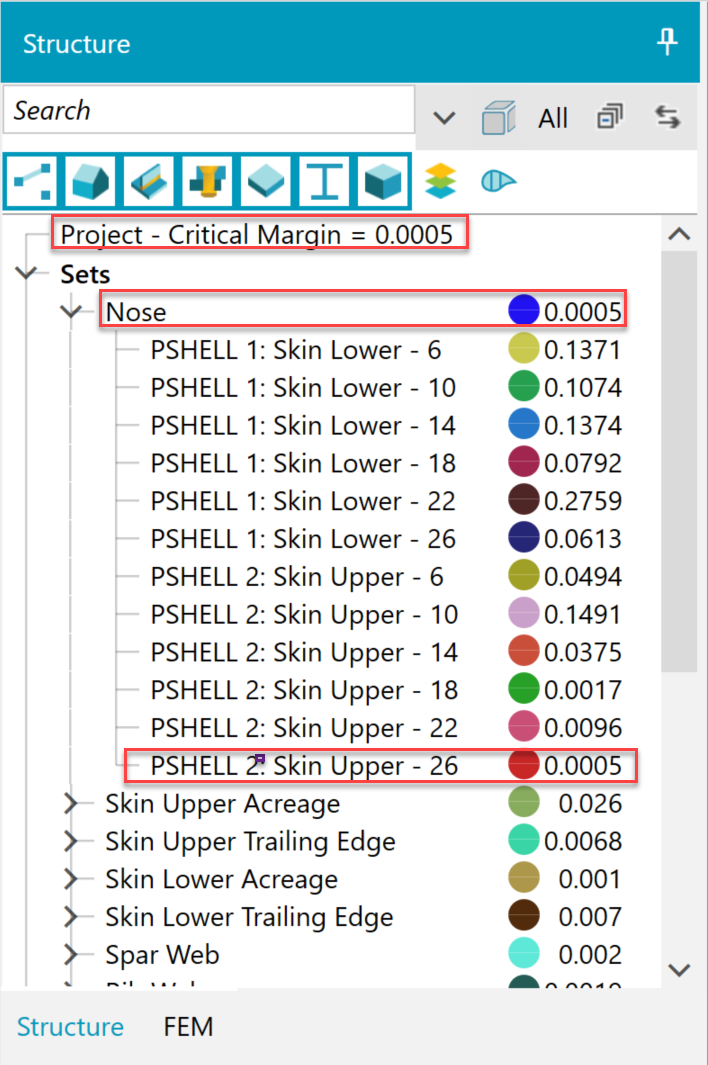

Left: Weights of each zone, each set, and project. Right: The lowest critical margin of any zone is reported as its set margin. The lowest set margin is reported as the project margin.
Properties
There are three primary data property types within HyperX.
- Analysis Property – failure analyses to perform
- Design Property – materials, dimensions, variable bounds (if sizing)
- Load Property –FEA loads processing technique and design-to loads
Analysis, Design, and Load properties give the user oversight over how the model is set up. You can manage failure analyses, dimensions and materials, and FEA load extraction methods in a single location.
Property data is the primary way for a user to setup their project. Assigning properties is as simple as dragging-and-dropping from the property tree to the viewport. Interaction between the tree and viewport allow the user to visually identify which zones are assigned a given Property. All four of the trees are in sync with the viewport at all times – providing multiple ways to manage visibility, selection, organization, and assignment.
Properties can also be included in HyperX database templates to standardize processes among a group of engineers.
To learn about the properties and the drag-and-drop ease of use, we encourage you to watch the essential video “Fundamentals”
Watch Window
A user can interactively display hundreds of different types of analysis and design sizing results in a compact table format.
This watch window (WW) form shows a compact view of data in a row-column table format. Users can sort any column. Interactively select zones via the viewport or tree, and the WW form will immediately populate with data. Conversely, highlight any data value in the WW and the associated FEM zone will highlight in the viewport.
When analysis is executed, the data will update. Several WWs can be opened at same time.
What follows is a typical use case: The user has a WW open after analyzing their structure. They ‘lock’ that WW, then change an input data value and rerun analysis. The user opens another WW (which defaults to displaying the last selected column types of the previous WW), and sees the same information with new data values. They can inspect the difference between the two WWs side-by-side to investigate how changes to their input affect their results. To preserve column preferences, the user can save templates with their favorite column data types to show in the WW.
The watch window provides a streamlined process to inspect and evaluate real-time computed data. Engineers get their jobs done faster and shorten their schedules by confirming the correct input data and intermediate calculated values while they analyze.
The analysis watch window is a HyperX special use case of the WW with a predefined view of results – each row corresponds to a failure analysis, and each column corresponds to a zone ID. It provides visibility into margins of safety, which enhances analysis traceability, especially when used to inspect the difference between two opened WWs. The analysis watch window is described in the analysis workflow and certification sections of this website.
Process Monitor
As an analysis or sizing run is executing, the process monitor displays a progress summary of completed results, as well as logs, warnings, and errors with suggested corrections.
- The Process Monitor provides intermediate results and runtimes per computational step during analysis to view analysis progress
- It provides information, warnings, and error messages to help user diagnose issues during runs
- It is particularly useful for long running jobs to peer inside and gauge the run’s status
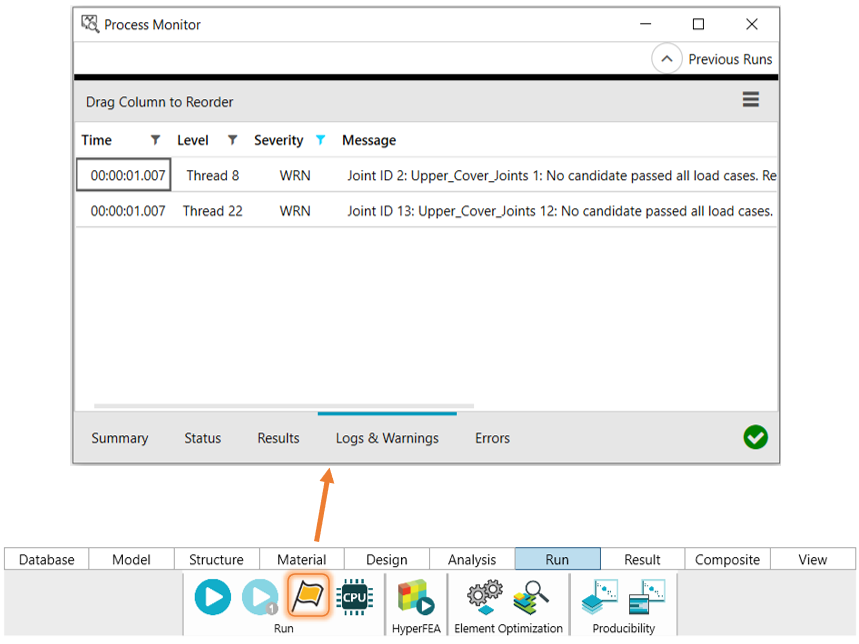

The process monitor enables a reduced schedule by allowing engineers to better manage their runs. The user has visibility regarding the run’s progress, which allows them to earlier terminate processes to correct bad data and start over without wasting time.
It also shortens schedules by providing engineering results early in long running jobs while analysis is ongoing, providing insight into engineering decisions.
Scripting API
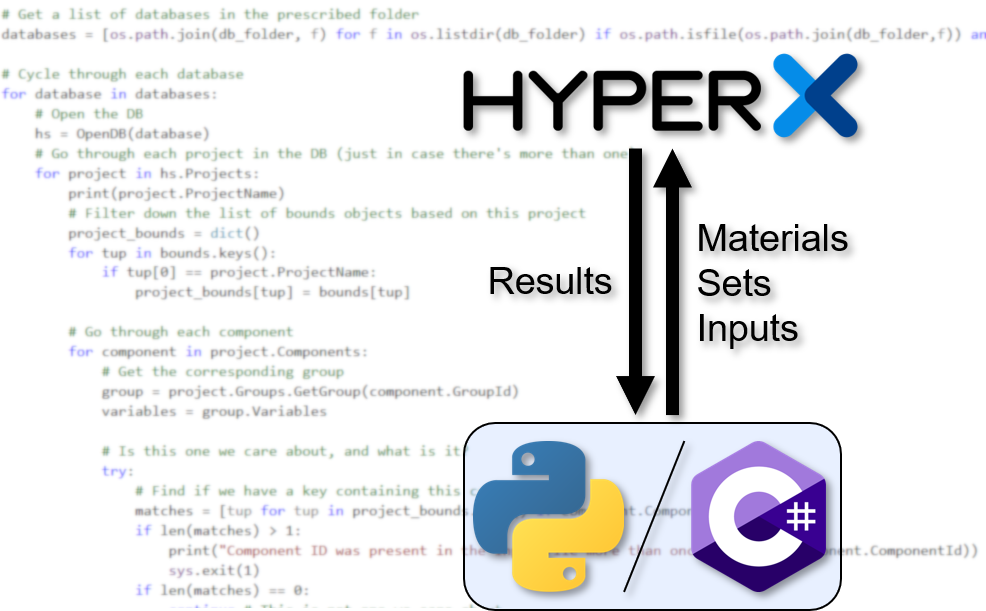
Automate repetitive process tasks through code or seamlessly incorporate HyperX into larger software environments.
HyperX provides many utilities to automate repetitive tasks and efficiently input and extract data in convenient formats. In some cases, it is beneficial to use scripts for custom processes and to automate tedious tasks. Some common applications for scripting include:
- Customized project setup (structure and set definitions)
- Importing materials from a different format
- Incorporating HyperX into a custom process, such as a multidisciplinary optimization loop
The HyperX scripting API is easy to use and accessible from multiple programming languages such as Python and C#.

Contact Us
This site is protected by reCAPTCHA and the Google Privacy Policy and Terms of Service apply.
