HyperXpert: Design Insights
Feature Pages
Challenge
To understand HyperXpert is to understand two fundamental topics: (1) the idea of design variance across a part surface as a measure of producibility, and (2) quantifying the producibility variance impact on weight.
This simple example will illustrate the importance of both.
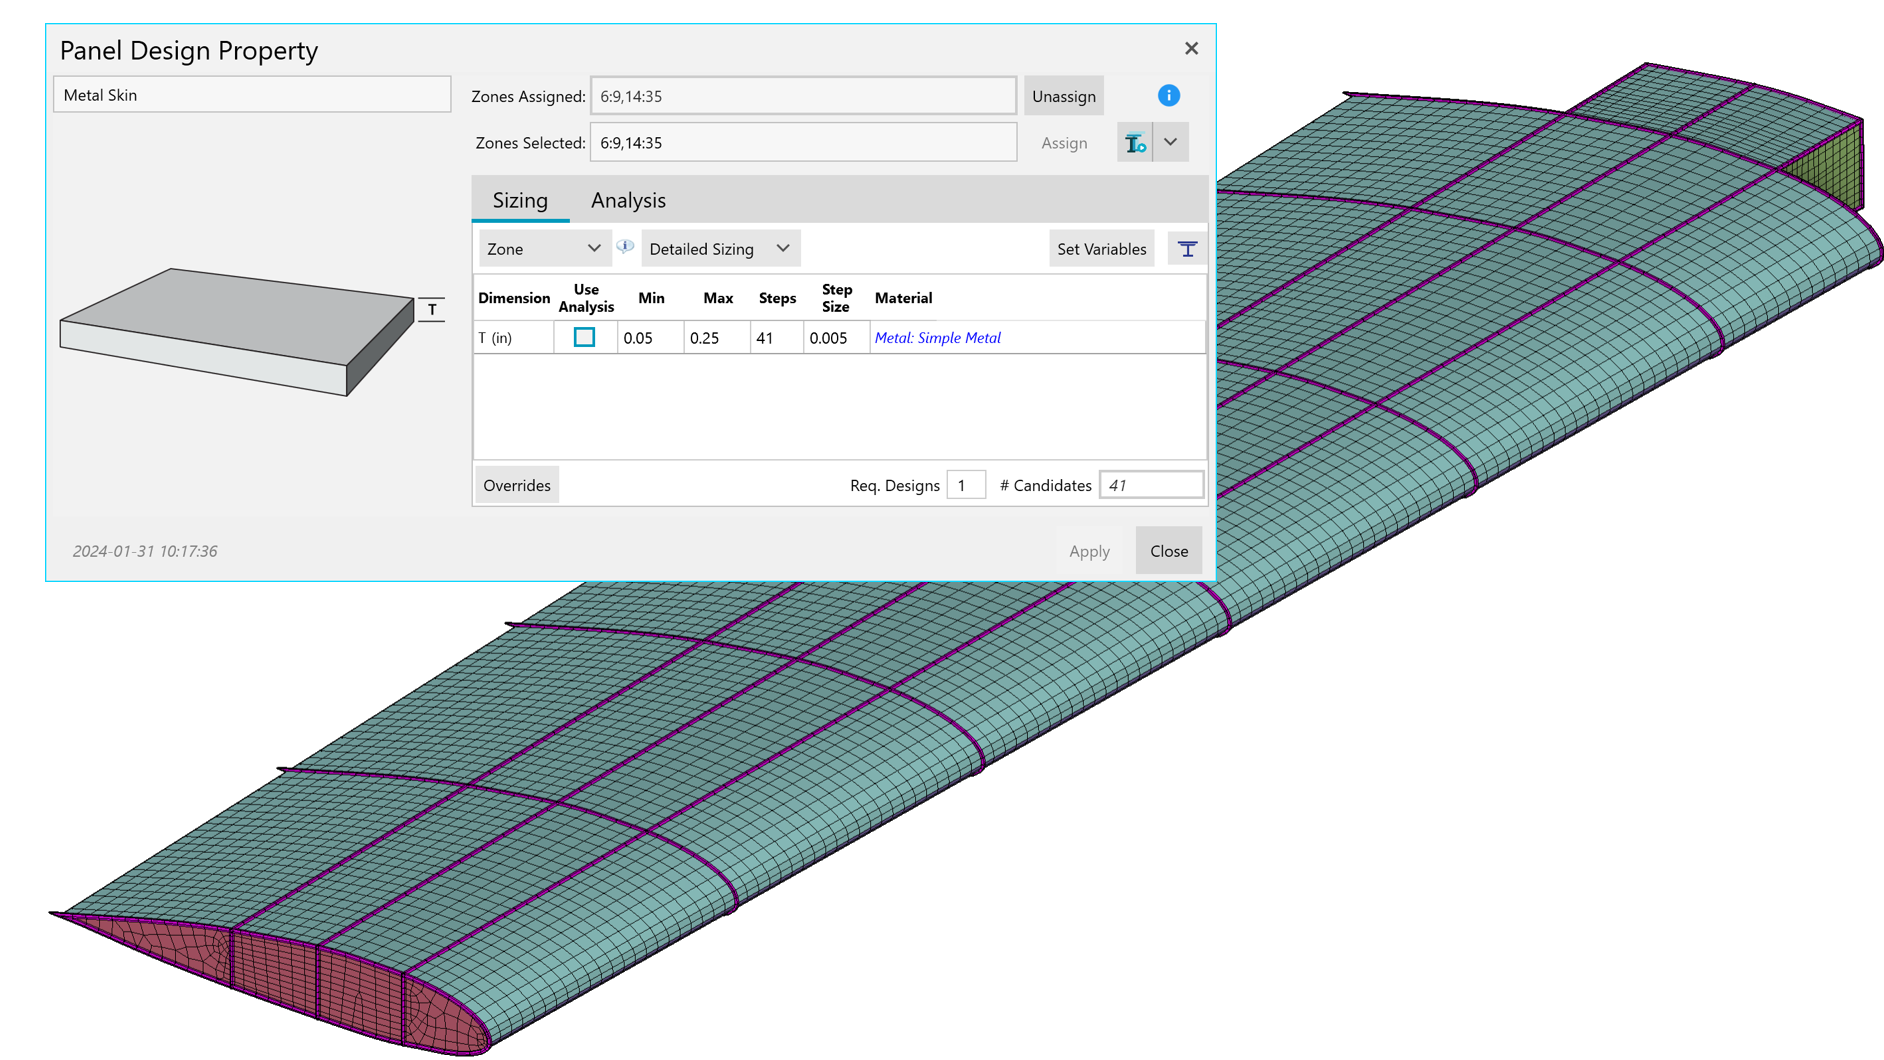
Take the UAM wing shown below. For simplicity’s sake, let’s say you’d like to size the upper skin as a metal plate. All possible thicknesses are given to define the design space.
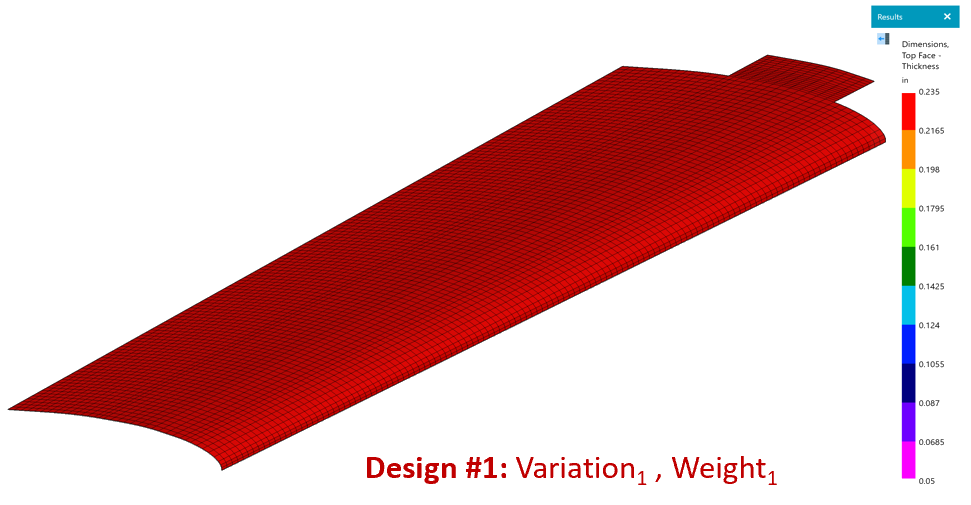
Running a preliminary sizing on the entire upper skin, HyperX will find the thinnest plate that satisfies all strength and stability criteria. This is the most producible design, since there is no variation across the skin surface. Let’s call this Design #1.
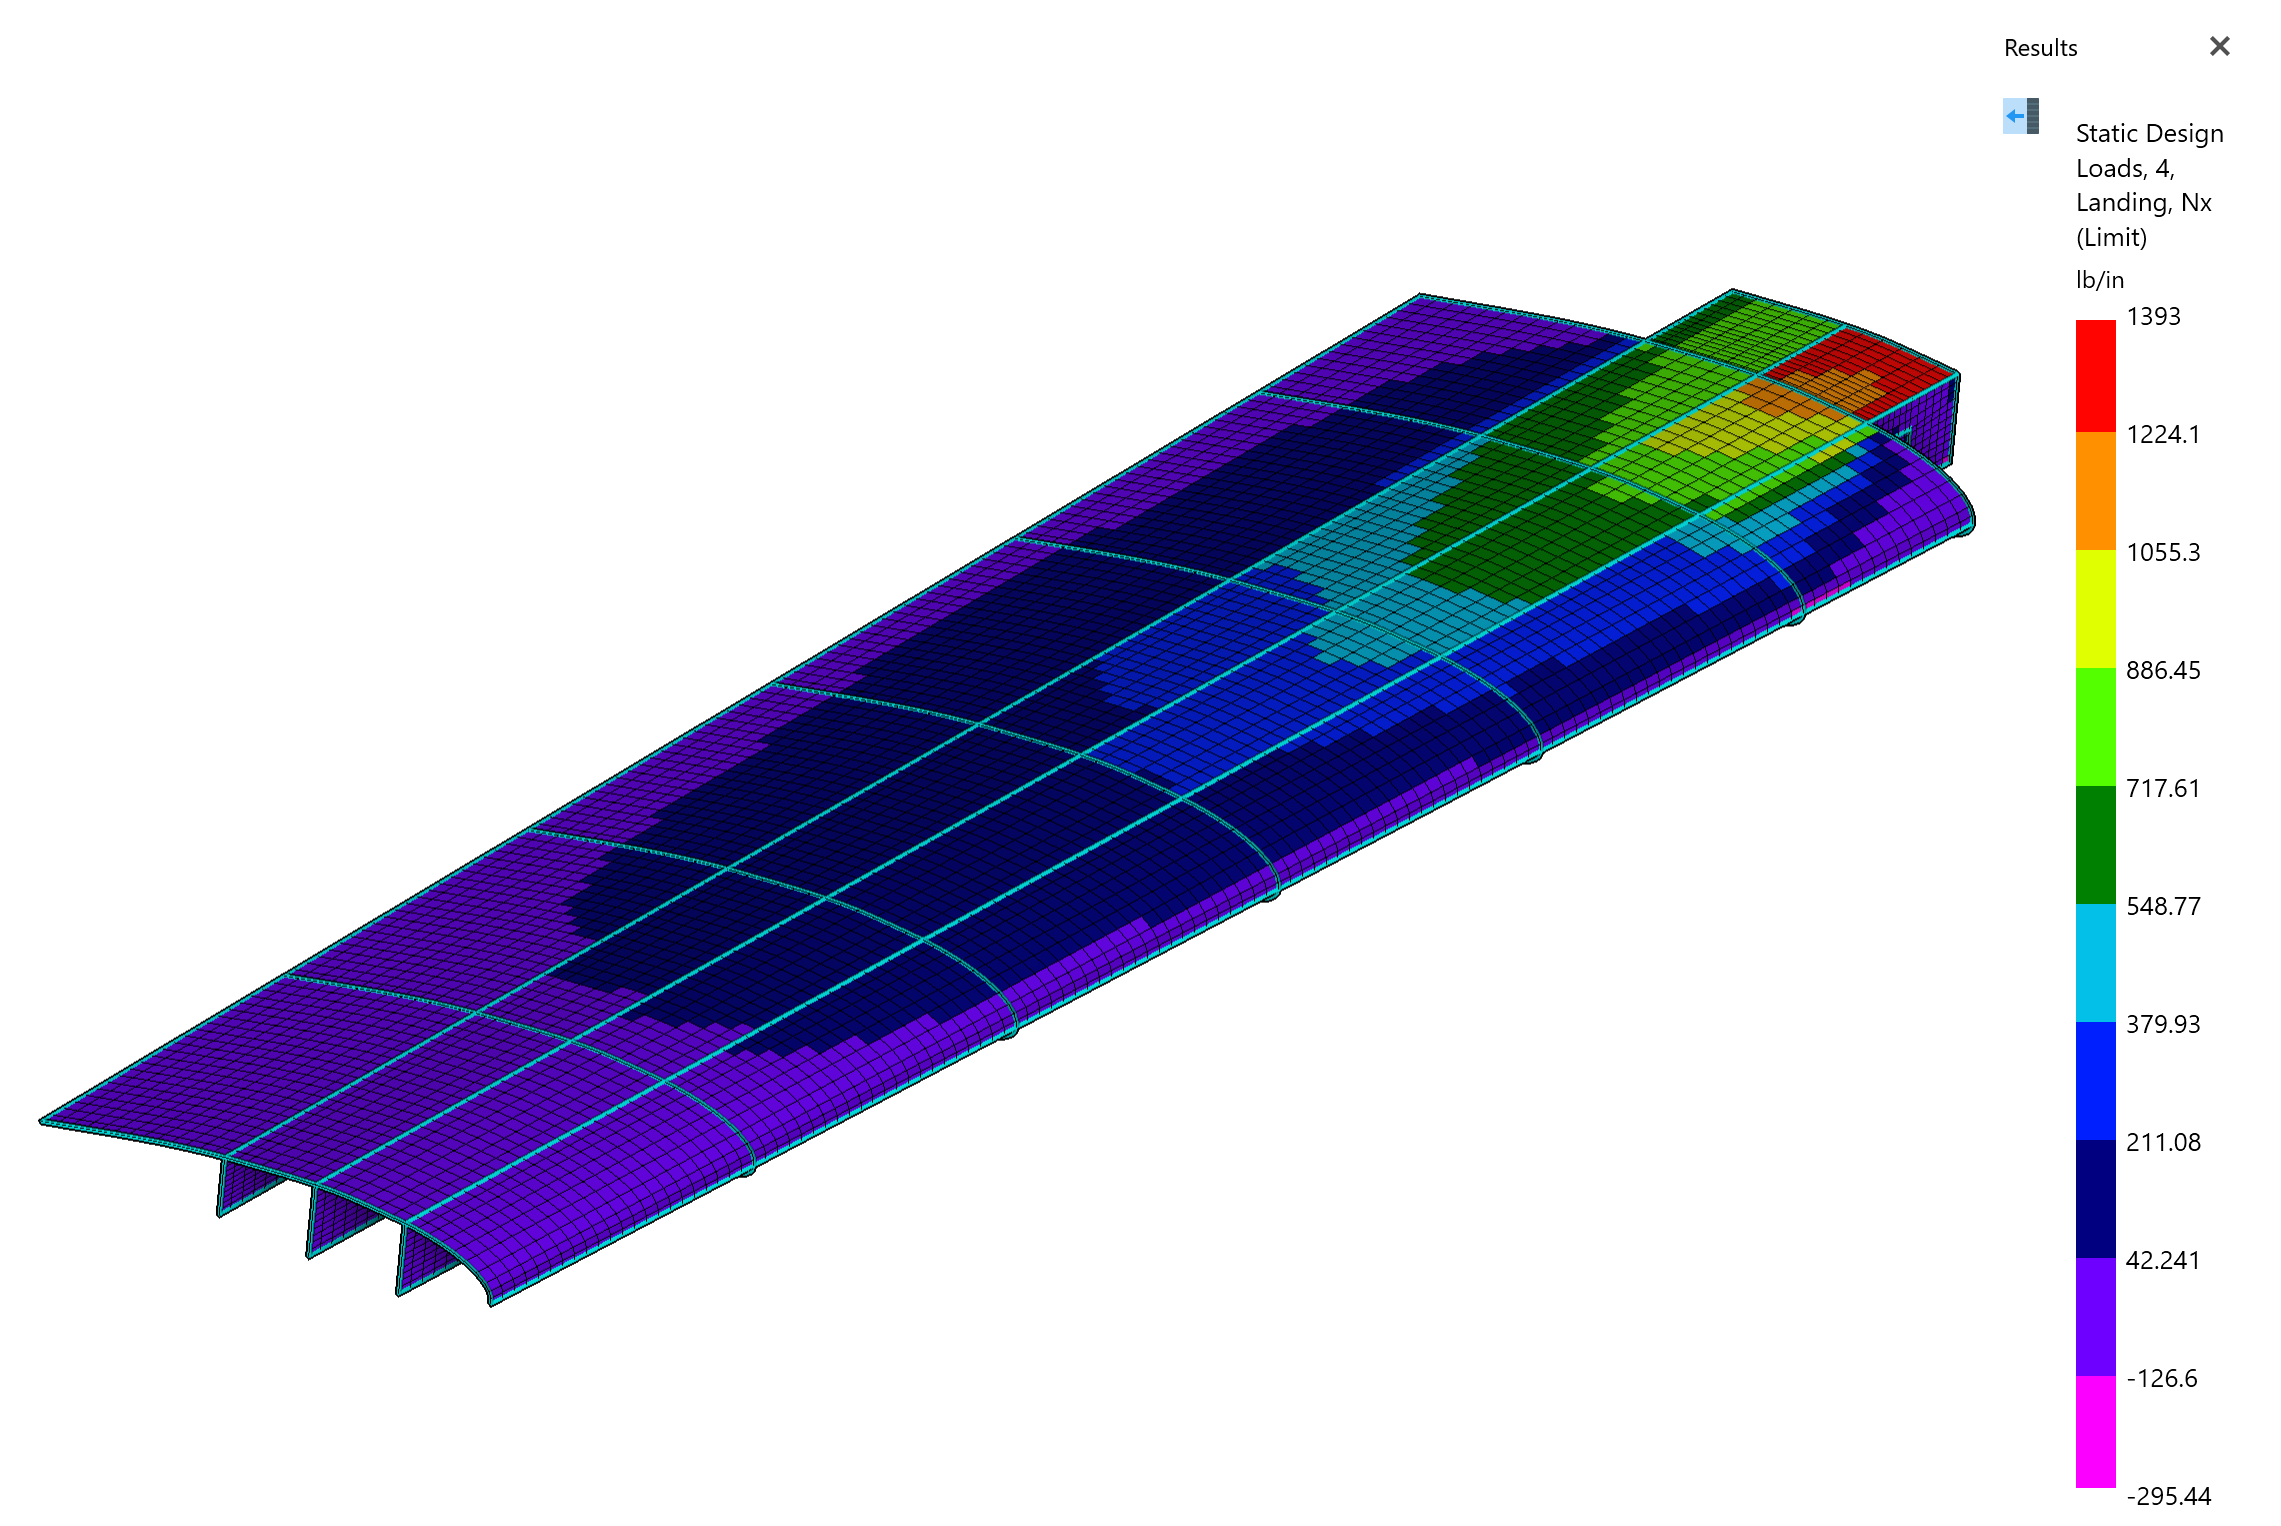
The figure below illustrates the individual panels of the upper skin formed by the rib-and-spar-substructure and the corresponding Nx load gradient for one of the critical load cases.
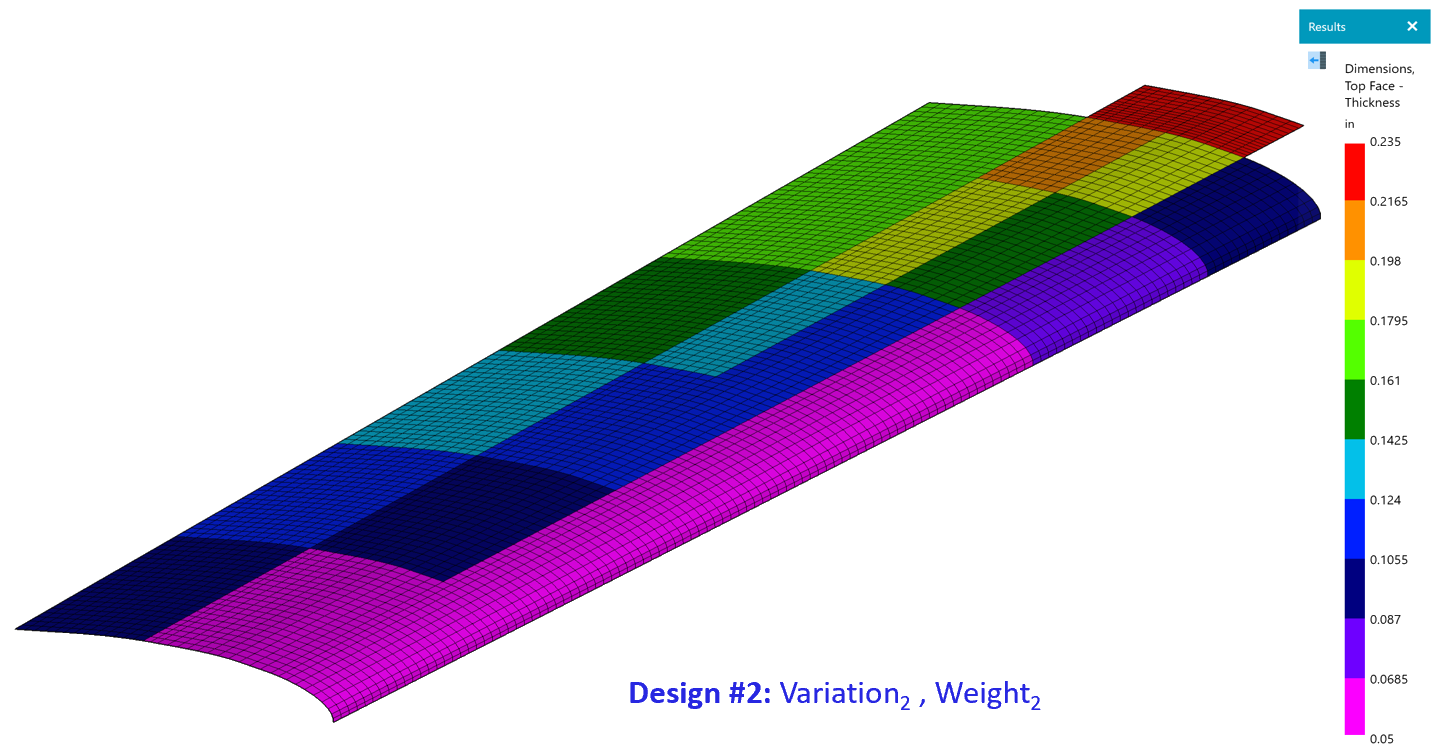
It is typical aerospace practice to allow particular design variables – in this case, thickness – of each panel to vary across the part surface. In this instance, HyperX will find the thinnest plate that will survive the load for each panel, rather than assigning the controlling thickness to the entire surface. This is the lightest weight design, but comes with increased variation in design across the skin surface (and therefore a decreased level of producibility by comparison to Design #1). We’ll refer to this as Design #2.
For each design, which are both considered viable options for this upper skin part, a variation score (based on the amount of change in design variables across the part surface) and corresponding weight are calculated.
By plotting weight vs producibility, these values can be visually compared to one another.
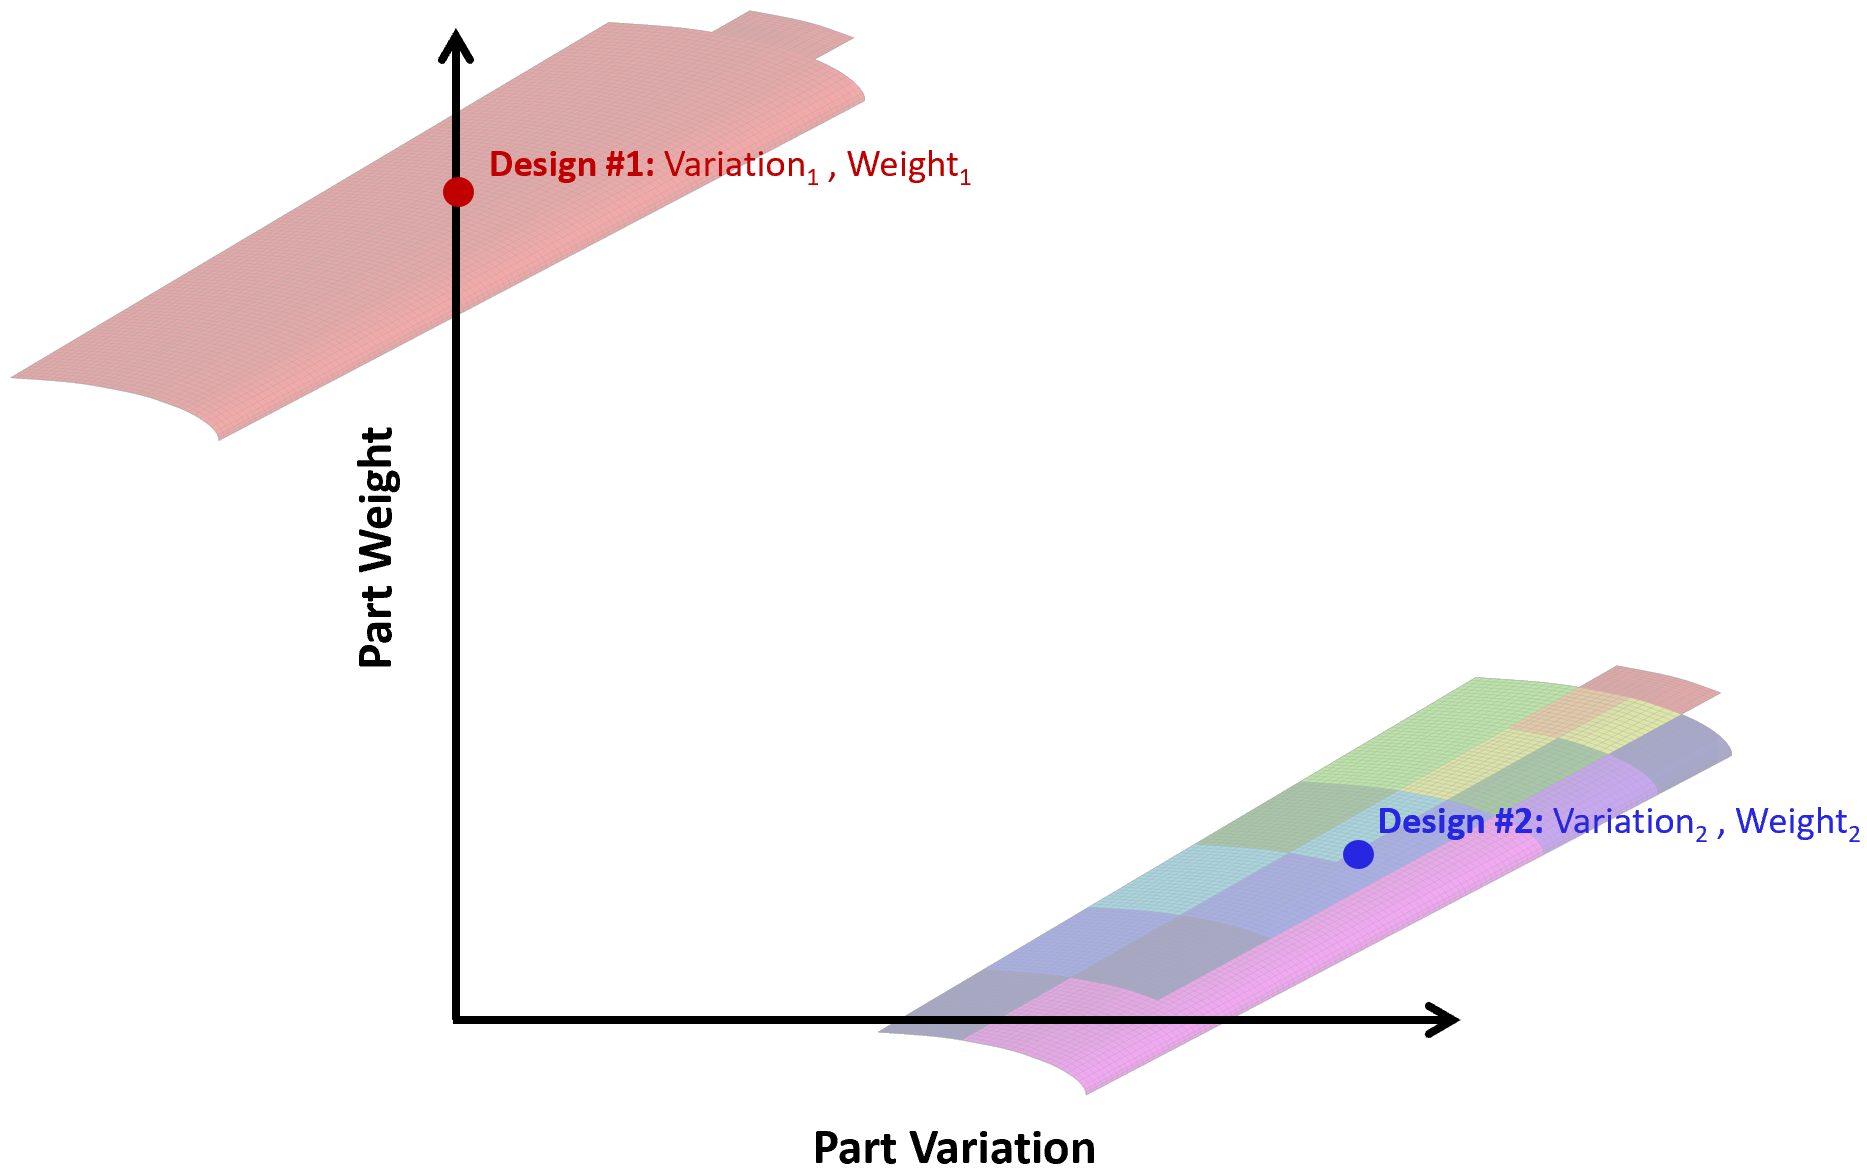
The two designs tracked so far represent the bookends of this problem. Based on the number of candidates in the given design space and the number of panels in the wing skin part, there are potentially 1000s more skin part designs.
By running a full factorial design of experiments (DOE) we can systematically identify all viable wing skin designs, calculate their corresponding weight and variation, and plot them accordingly.
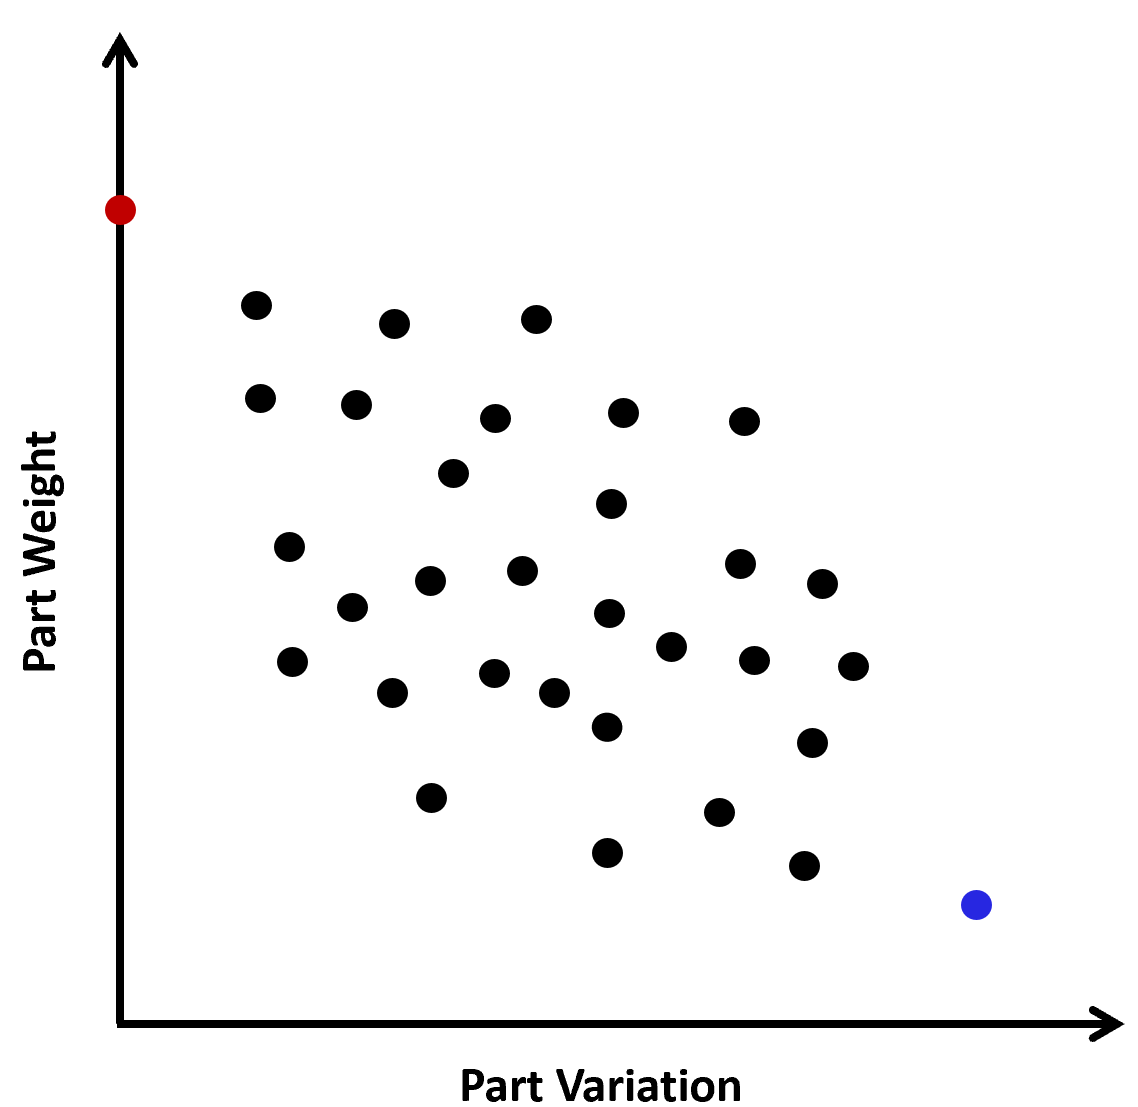
This plot provides engineers a way to compare designs, understand trends, and ultimately select the design that best meets their needs.
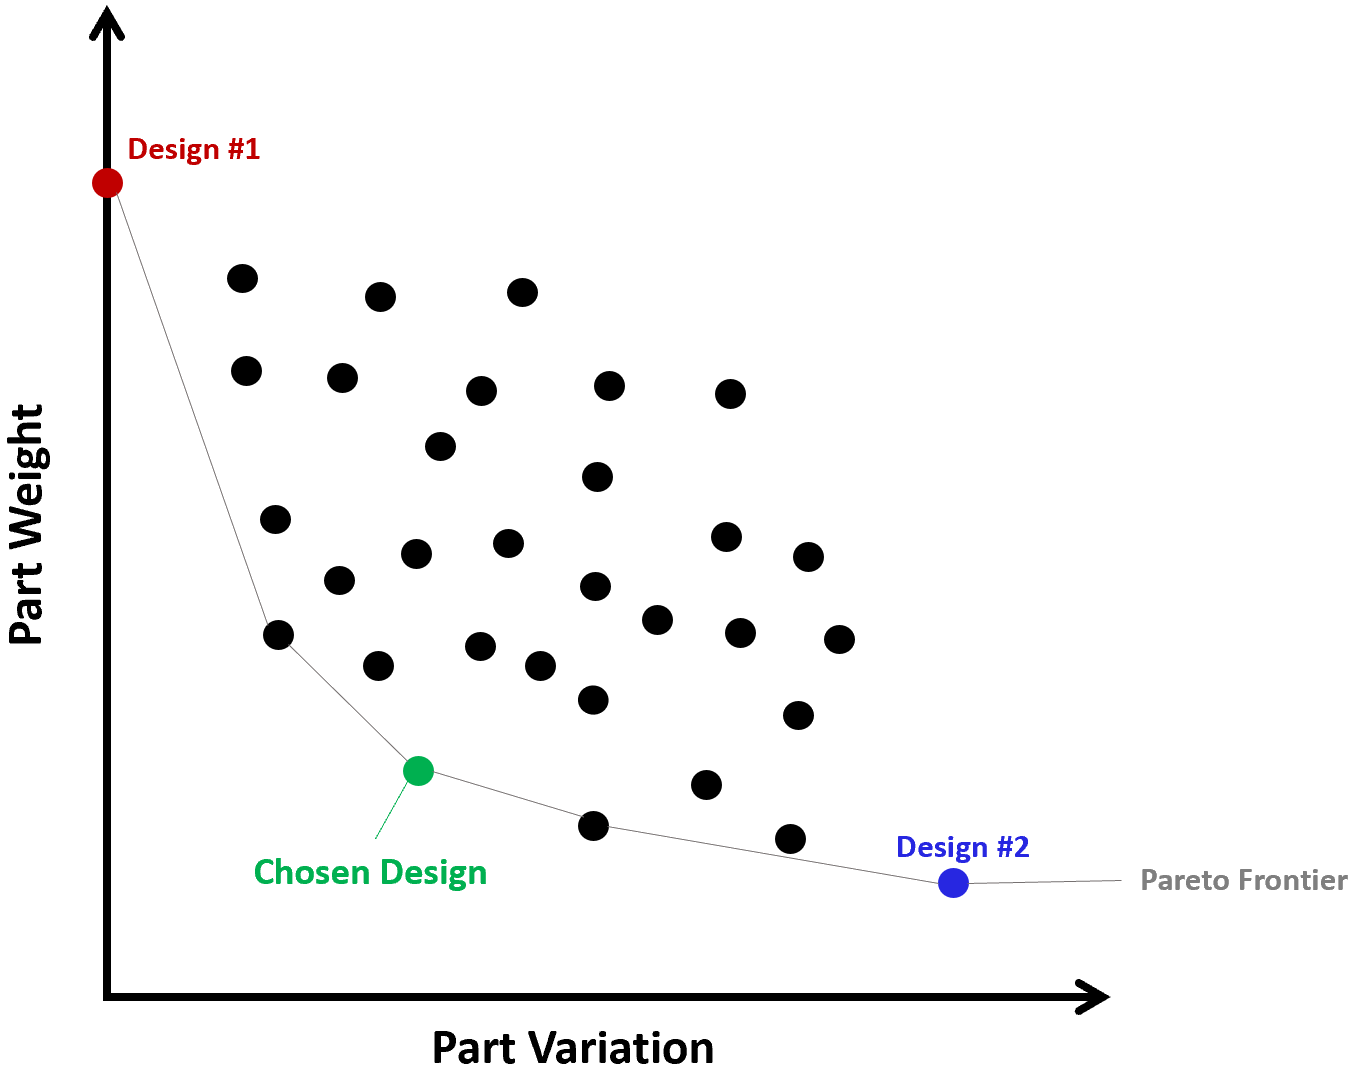
For this simple example, it may seem possible to programmatically tune the input variables, run HyperX, extract the results, assign each result a weight and variability score, and plot the results externally. And that’s true. But, you could imagine this process would get increasingly tedious, time consuming, and computationally intensive as the number of design variables increased. For example, what if you wanted to implement T-stiffeners down the length of the wing. Now, not only can each panel vary in thickness, but it can also vary in stiffener spacing, width, thickness, and so on.
